
Good morning everyone and welcome back to a new Tooldech article! Today we’ll talk about two tools combined together: Prometheus + Grafana!
Do you want to monitor hosts and containers in a few minutes using standard open-source tools? In this guide we configure… Prometheus (metrics collection) and Grafana (visualization) with Docker Compose, including cAdvisor (metrics of containers) and Node Exporter (host metrics). It is designed for those starting from scratch and looking for a solution repeteable, document and ready for prod (with persistent volumes and automatic provisioning).
Why Prometheus + Grafana (and how they work)
Prometheus It is a “pull” monitoring system: it periodically queries some… exporter (HTTP endpoints) and stores time series.
Grafana It displays these metrics through dashboards, alerts, and interactive panels.
Architecture we are going to create:
- A docker-compose with 4 services: Prometheus, Grafana, Node Exporter, cAdvisor.
- Prometheus → collects metrics from:
- Node Exporter (host status: CPU, RAM, disks, network)
- cAdvisor (Docker container status: CPU, memory, I/O)
- Prometheus stesso (autoscrape, useful for health checks)
- Grafana → connected to Prometheus as a data source to create dashboards.
Result: You have visibility on health and performance, identify bottlenecks, and prevent incidents.
Prerequisites
- Docker and Docker Compose v2 installed
- Free port:
3000(Grafana),9090(Prometheus),9100(Node Exporter),8080(cAdvisor). - Operating System: Recommend Linux. On macOS/Windows with Docker Desktop Node Exporter has limited visibility on the host (you can still try it).
Rapid verify:
docker --version
docker compose version
Structure of project
Let’s create a folder with the code and configuration files.
mkdir monitoring-docker-stackOnce created, we move into it.
cd monitoring-docker-stack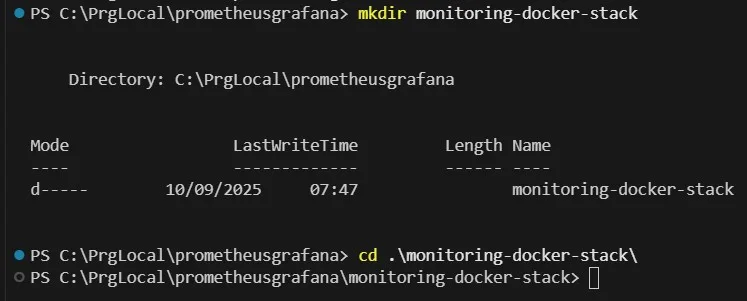
Configuration file
1) Prometheus
In the first step, it is used to configure Prometheus by telling it where to collect the metrics from — a sort of map that defines which services to monitor and how often.
Create the folder and move into it.
mkdir prometheus
cd prometheus
With the prometheus.yml file inside it. Basically, you define:
- how often it should perform the scrape (default 15 seconds).
- only job (Prometheus, Node Exporter, cAdvisor) → that is, a set of targets;
- the endpoint (host:port) that Prometheus has to query;
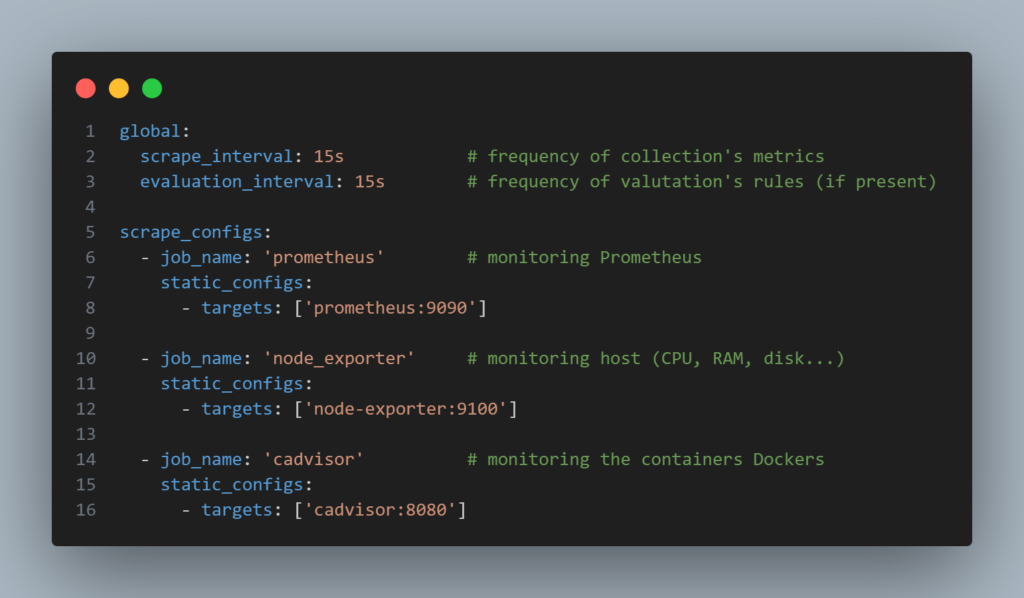
Explain rapid:
scrape_interval: scrape interval (15s is a good compromise).- Three jobs: Prometheus, Node Exporter, and cAdvisor; the names are resolved thanks to the rete Docker
monitoring.
2) Grafana
Imagine what this could do… configuring Grafana so that it already has the connection to Prometheus ready.
Same procedure
mkdir grafana/provisioning/datasources
cd grafana/provisioning/datasources
And let’s create our file inside the datasource.yaml folder.
Basically, in the file datasource.yml you tell a Grafana
- that it must be the default for all the dashboard.
- what data source use (Prometheus).
- where to find it (
http://prometheus:9090inside the Docker network).
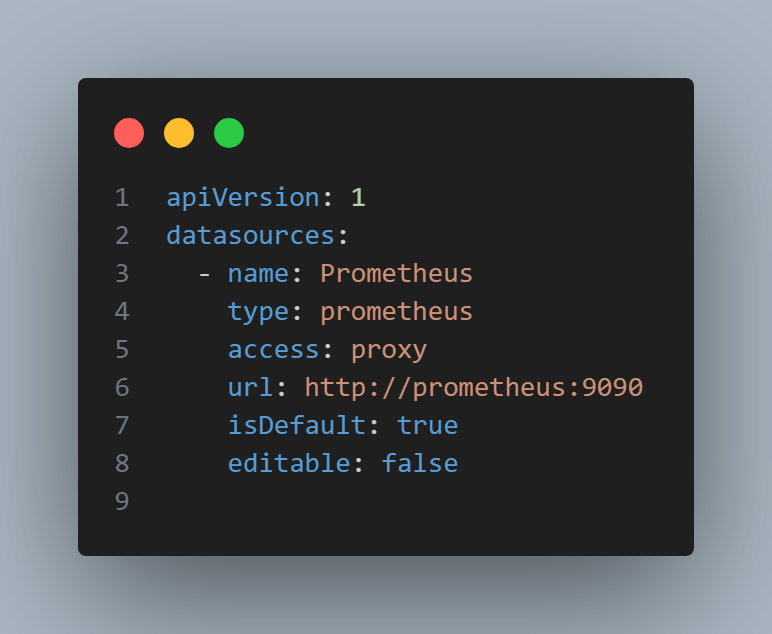
What does it mean
isDefault: true: it will be the default data source for new dashboards.type: prometheus: type of data source.access: proxy: the queries go through the Grafana backend (useful in a private network).url: Docker service name + port.
3) docker-compose.yml
Let’s start with the final step of the hands-on part: creating the docker-compose file, which will include all the components needed to bring the stack up.
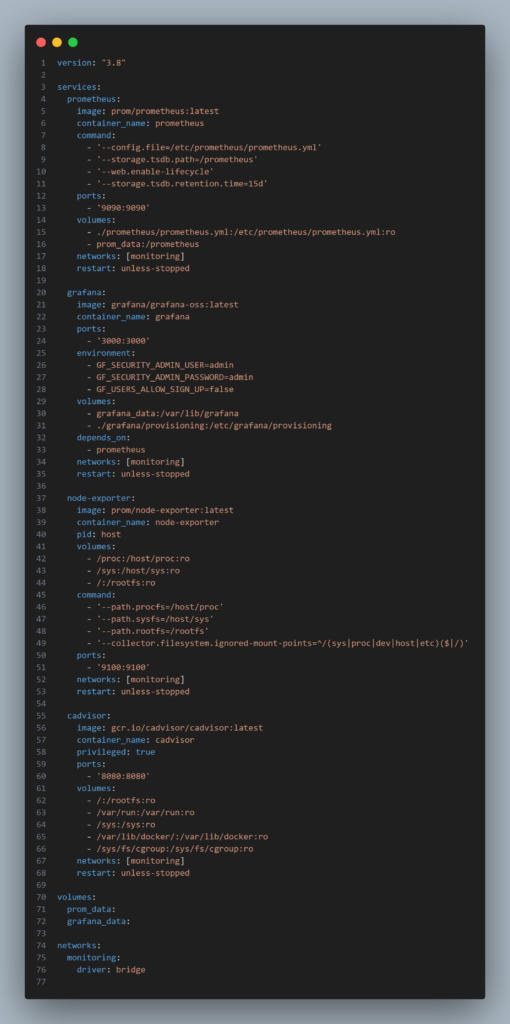
Create the docker-compose.yaml file in the root of the project:
Explain rapid:
ports: exposes the UIs outside Docker (localhost).volumes: data persistent (prom_data,grafana_data) + configuration mounts.commandIn Prometheus: set the config path, data retention, and the reload API.node-exporter: legge/proc,/sysand the host’s root fs in read-only mode;pid: hostImproves visibility of processes.cadvisor: mounts the host directory to read metrics about containers.privileged: trueand mount of/sys/fs/cgrouphelp on systems with cgroup v2.
Note macOS/Windows: Node Exporter and cAdvisor will see the Docker Desktop VM, not the real host.
Security note: in production, change the Grafana passwords, restrict access to the ports (firewall/VPN/reverse proxy), and specify the versions image specifications (avoid
:latest).
Start of stack
I’d like to clarify that the stack was started on a Linux machine, just for convenience!
At this point, we are ready to start the stack from inside monitoring-stack, with the commands:
docker compose up -d
docker compose ps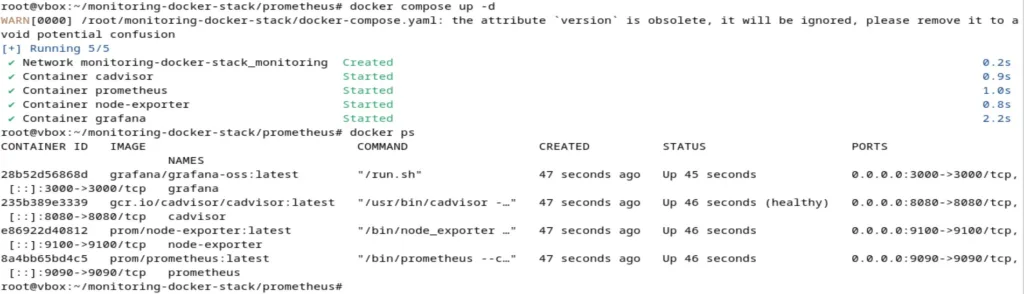
You should see 4 containers running.
Verify the demo is working
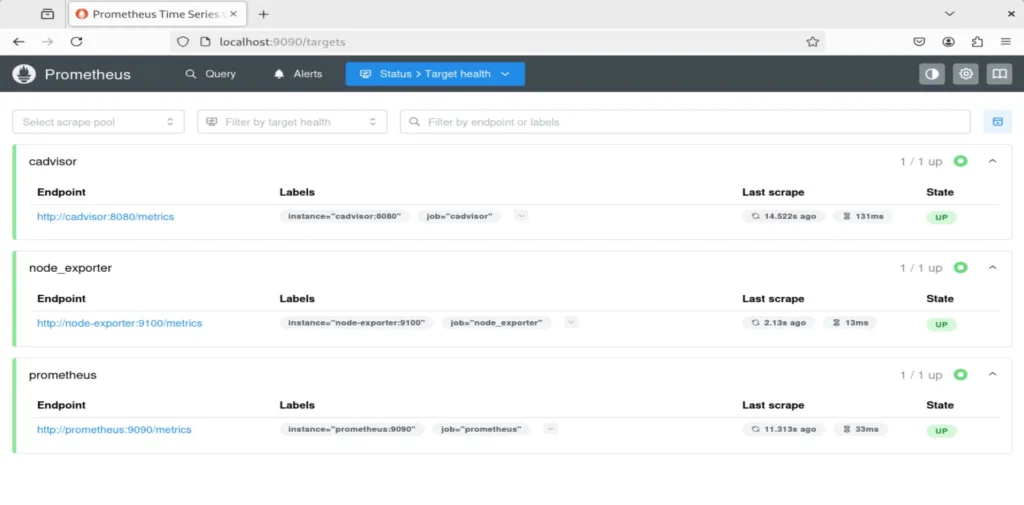
1) Prometheus check
We’ve reached the application monitoring part; let’s start by seeing what we can observe from Prometheus.
- Open http://localhost:9090→ Status → Targets
You should see the jobsprometheus,node-exporter,cadvisorwith state UP.
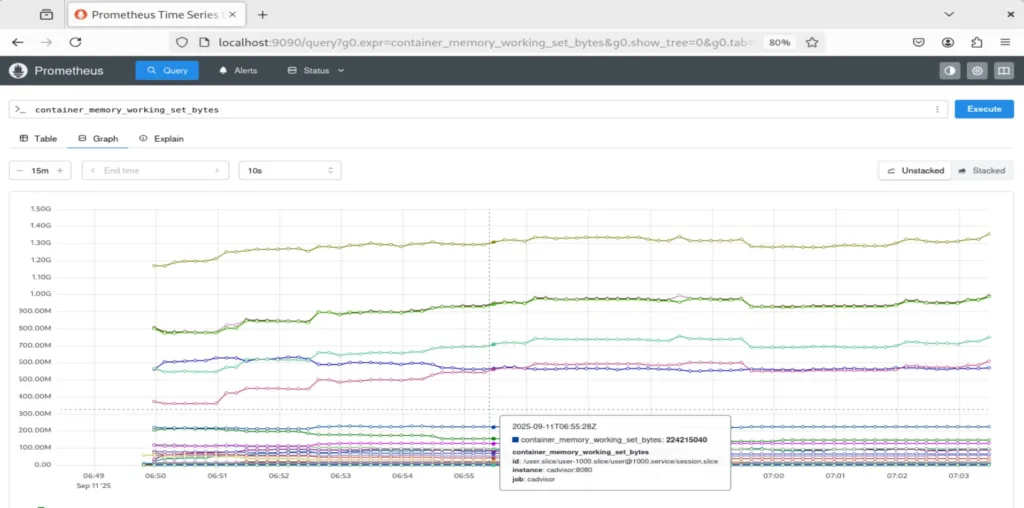
- Quick query test ( menu Graph) Here are some of the queries you can run:
up→ shows if the targets are responding (1 = ok).node_load1→ 1-minute average load of the host (Node Exporter).container_memory_working_set_bytes→ memory usage per container (cAdvisor).
2) Grafana access
Let’s check the second application running, which is Grafana.
- Open http://localhost:3000
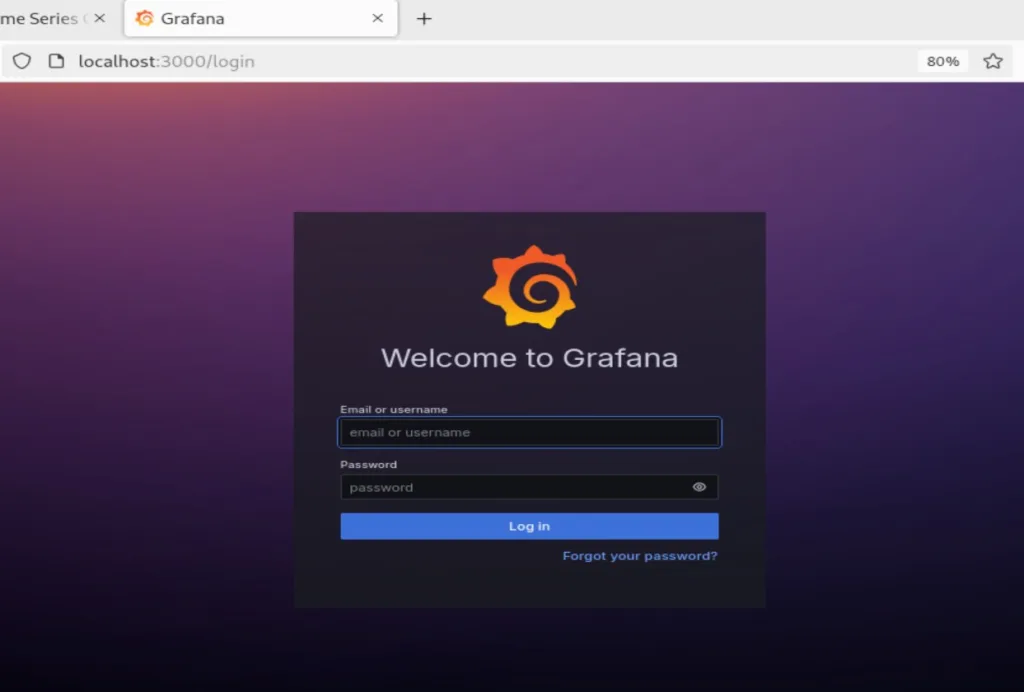
- Login: user –
> admin / password -> admin→ change password when requested.
On Dashboards → New → Add visualization → Prometheus and try a query:
- How to Create a Minimal Dashboard (in 2 Minutes)
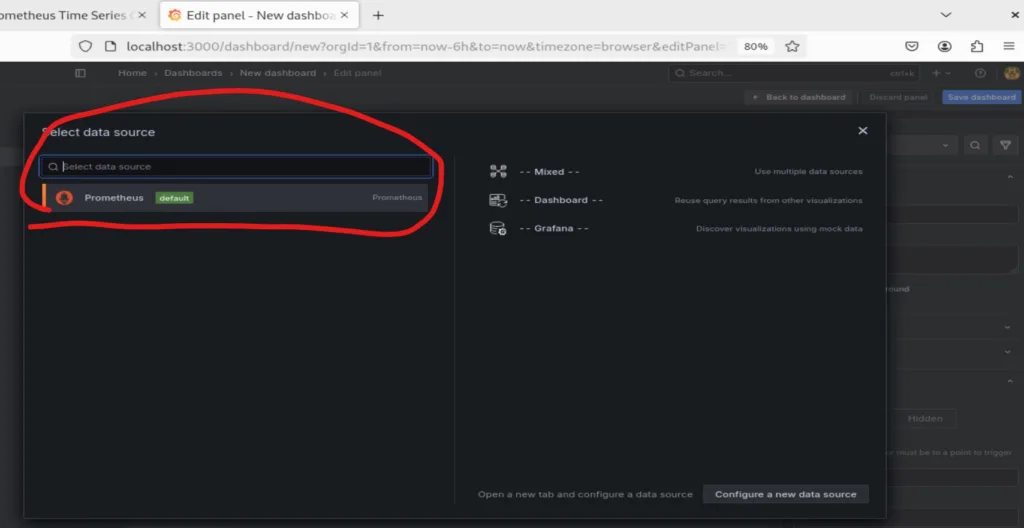
In Grafana: Dashboards → New → Dashboard → Add a new panel.
Select the data source Prometheus.
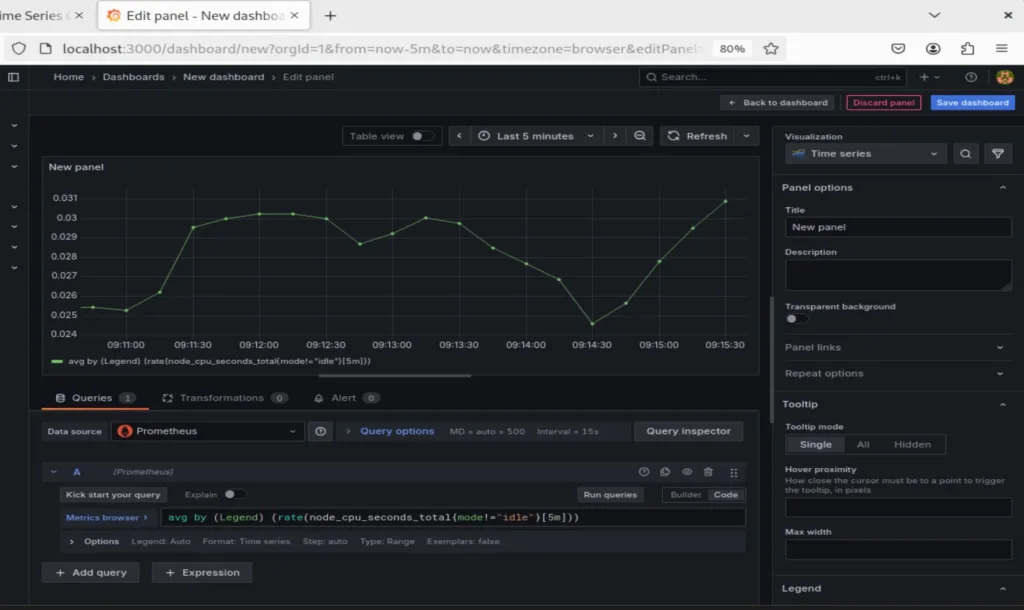
Enter the query (example: average host CPU):
avg by (instance) (rate(node_cpu_seconds_total{mode!="idle"}[5m]))Set Legend su {{instance}}, save it as “Host Overview.”
Add a second panel for memory to include an additional query.
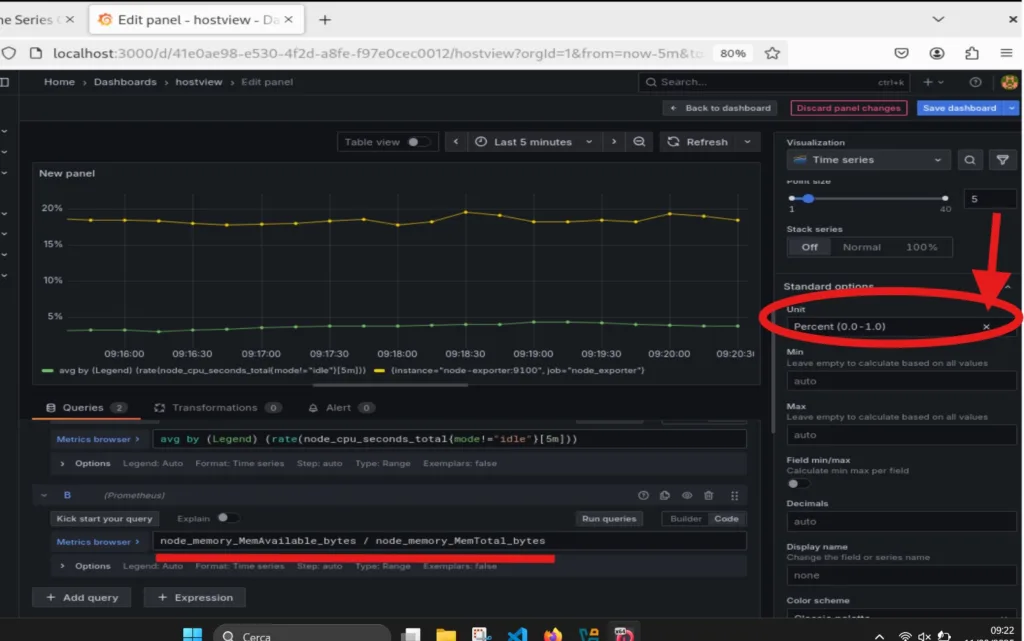
N.B. you need to scroll down
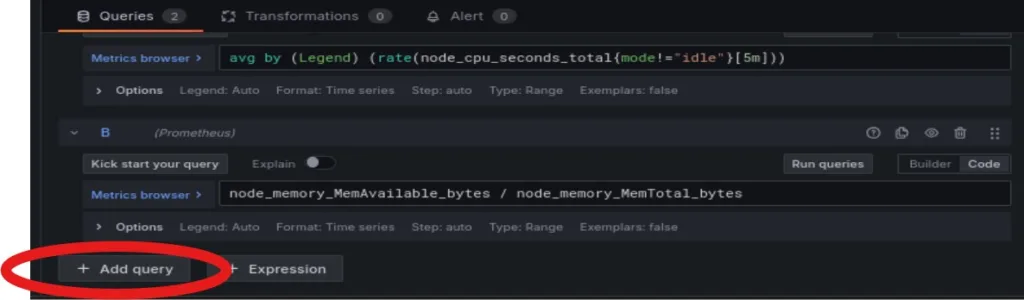
node_memory_MemAvailable_bytes / node_memory_MemTotal_bytes- select Unit → Percent (0-1) To get a percentage, go to the scroll bar on the right where you’ll find a variety of parameters. Scroll down until you see Unit and then select Percent.
Conclusion
We’ve reached the end of this article. I hope it helped you understand how these two applications work. If used correctly, they can be very useful for monitoring the resources of our stacks.
Cheers, and see you in the next Tooldech tutorial!
Follow us on our social media!
Abbiamo notato che il tuo sito Web non ha ricevuto molto traffico ultimamente. Come promemoria amichevole, offriamo pacchetti pubblicitari esclusivi che possono aumentare notevolmente la tua presenza online e attirare nuovi visitatori sul tuo sito. — rb.gy/ydlgvk?gar
ottimo tutorial grande
Grafana is the best tool of monitoring.
Finally an article that explain the usage of this tool!
Articolo semplice ma strutturato.
Dovresti alzare la qualità degli articoli
ottimo articolo!!
Cool!!!